Overview
The Look@NanoSIMS (short LANS) Matlab module written by Lubos Polerecky (Polerecky L., Adam B., Milucka J., Musat N., Vagner T. and Kuypers M. M. M. (2012) Look@NanoSIMS - a tool for the analysis of nanoSIMS data in environmental microbiology. Environ. Microbiol. 14, 1009–1023.) makes it easy to process NanoSIMS data and draw regions of interest (ROIs). The lans2r package provides a convenient interface to import ion maps and ROI data generated by LANS for processing and plotting in R/RMarkdown. Additionally, it can process NanoSIMS tuning (HMR) files.
Usage
Once installed, load the package with:
A concise overview demonstrating the functionality of the lans2r package is provided in the main vignette for the package, which can also be accessed from within R by calling vignette("lans2r"). Additional vignettes provide details on extended functionality and can be accessed easily by browsing the package vignettes from within R calling browseVignettes("lans2r"). For details on individual funcation, please consult the package help (e.g. ?load_LANS_summary).
Example
library(dplyr) # use of %>% and filter
library(lans2r) # the lans2r package
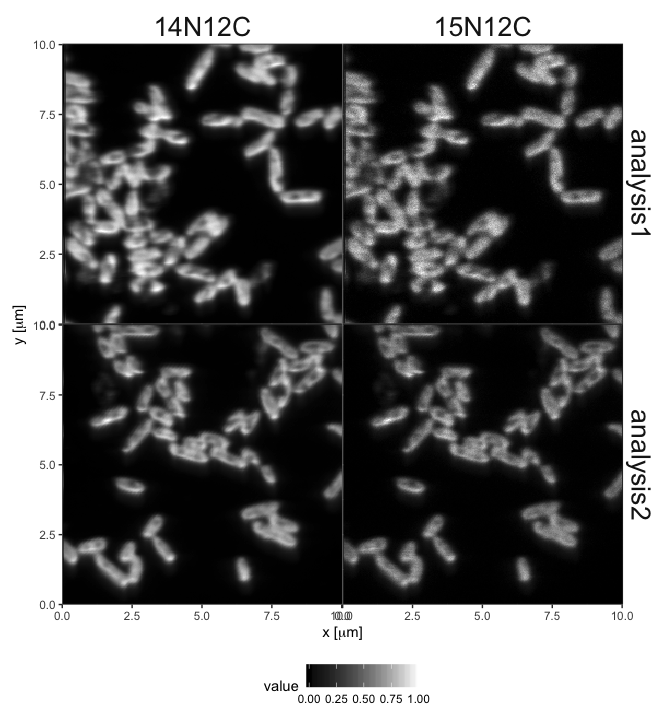
# load two of the data sets supplied with lans2r
load_LANS_maps (
analysis = c("analysis1", "analysis2"),
base_dir = system.file("extdata", "nanosims_data", package = "lans2r")
) %>%
# focus on the NC ions
filter(variable %in% c("14N12C", "15N12C")) %>%
# plot the ion maps normalized by ion counts for each ion
plot_maps(normalize = TRUE, draw_ROIs = FALSE)